![]()

The use of Nielsen Media Research's SIGMA electronic monitoring system continues to push TV PSA evaluation to new heights and shatter myths about the placement and shelf life for PSA campaigns.
Goodwill Communications, which has used the SIGMA system for over seven years, has developed a benchmark resulting from seven typical PSA campaigns covering a variety of issues as well as the top five performing releases.
A recent campaign from the Make-A-Wish Foundation generated $9.7 million in verified advertising exposure. It was used on 526 stations (half of all those to which it was distributed) in 304 cities and received over 53,853 airplays in three different spot lengths.
Shattering Myths
In addition to building credibility for PSAs as a mass communications technique, SIGMA has also helped reverse widespread misperceptions about PSA effectiveness.
Using bounce-back cards as the evaluation mechanism, many PSA producers believe that PSAs are used in "junk" time from midnight to 6AM, when audience viewing levels are comparatively sparse. However, SIGMA usage data tells a different story. On average, for the seven campaigns in our benchmark model, 56% of all PSAs aired during optimum dayparts from 9AM-10PM.
Another misperception held by many producers is the belief that only shorter length spots get aired by stations. Here again, SIGMA provides contradictory data. In those cases where a 60-second PSA was distributed to stations, they received from half to two-thirds of all airplays.
Finally, because very few bounce-back cards are returned from stations after a 12 week period, most PSA producers believe the shelf life for a PSA is about three months. However, the typical SIGMA tracking cycle is 26 weeks, and in every SIGMA campaign we have monitored, dollar values and airplays continue to build throughout the six month cycle.
"To test the shelf life of our 'Dinosaur' campaign, we let the PSAs run a full year and tracked them via SIGMA," points out David Starck, Savings Bonds advertising manager. "We found that even after 11 months, we were still getting good exposure across the country. The longer monitoring period provided a much more accurate picture of the campaign's impact," he said.
Perhaps the only weakness of the SIGMA system, which monitors all U.S. broadcast stations in 212 Designated Market Areas (DMAs) seven days a week, 365 days a year, is the lack of monitoring among broadcast networks. Existing technology does not permit Nielsen to accurately track and separate exposure generated as a result of network feeds, compared to airplays generated by direct delivery of TV PSAs to stations.
Local stations have the option of pre-empting PSAs in favor of paid commercials, and networks have no way of determining when this occurs. This is a major weakness of PSA monitoring, but Nielsen is working on a system to monitor airings within broadcast network programs and has expanded the number of cable networks it monitors which is currently 28.
"We have been studying and testing methods for accurately monitoring network programming for several years," points out Deb Anderson, Marketing Manager for Nielsen New Media Services. "While we have recognized the importance of offering the service, it is a very complex undertaking and we wanted to ensure that we would be able to provide highly accurate network data, just as we have done for commercial stations," she said. The new monitoring system will be based on a Nielsen Universal Encoder which can encode up to three levels of identification data and a redundant set of ID data to ensure that a SIGMA code will remain if local stations strip off or overwrite the code.
Nielsen encodes and monitors both lines 20 and 22 of the video signal, which greatly increases SIGMA detections.
(Nielsen has also established a station support program to encourage stations to modernize and maintain video equipment to ensure that the encoded information is retained on the station's broadcast signal.)
Benchmark TV PSA SIGMA Profile
- Unduplicated markets 198
- Number of stations using PSAs: 299
- Number of PSAs aired: 15,178
- Optimum daypart usage: (9am-lOpm) 56%
- Optimum lengths: (:60) 65%
- Average value: (millions) $2.544
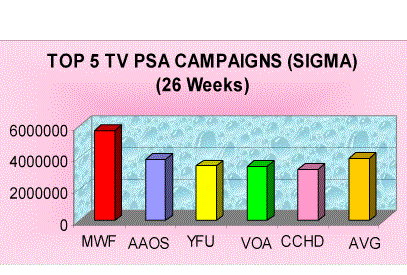
The following chart shows the top five TV PSAs we have monitored via the SIGMA system and the average for these campaigns is just under $4 million for 26 weeks of monitoring. Typically, those organizations that produce only a single PSA campaign annually are tracking for 52 weeks, rather than 26 and the values continue to build.
Broadcast Data Systems (BDS), the other major service providing passive monitoring, is also expanding its capabilities. It changed from using an audio footprint tracking methodology to a new passive monitoring system called Identification Coding Embedded (ICE), and increased its coverage by 25 markets. In the past, however, BDS monitored the top 75 markets and our PSA trend analysis shows that 52% of stations that use PSAs are located in the lower tier markets, (DMAS 76-211), meaning a substantial amount of exposure could be missed with this system.
Cable Networks to be monitored by SIGMA include:
- America's Talking Network
- Arts & Entertainment Network
- Black Entertainment TV
- CNBC
- CNN/CNN Financial/CNN International
- Comedy Central Discovery/Learning
- Channel E! Entertainment
- ESPN/ESPN 2
- Family Channel
- Foxnet FX Headline News
- Network Lifetime Network
- MTV/Nickelodeon
- Nick at Night
- VHl Nostalgia
- Nashville Network
- Sci-Fi Channel
- Travel Channel
- Turner Network TV
- Weather Channel
